SMART LIQUIDITY FRAMEWORK FOR TRADINGVIEW
See the levels that matter on your chart.
SLF is a TradingView indicator from JR Trades. It maps market structure and liquidity, grades setups, and plots targets and stops directly on your chart.
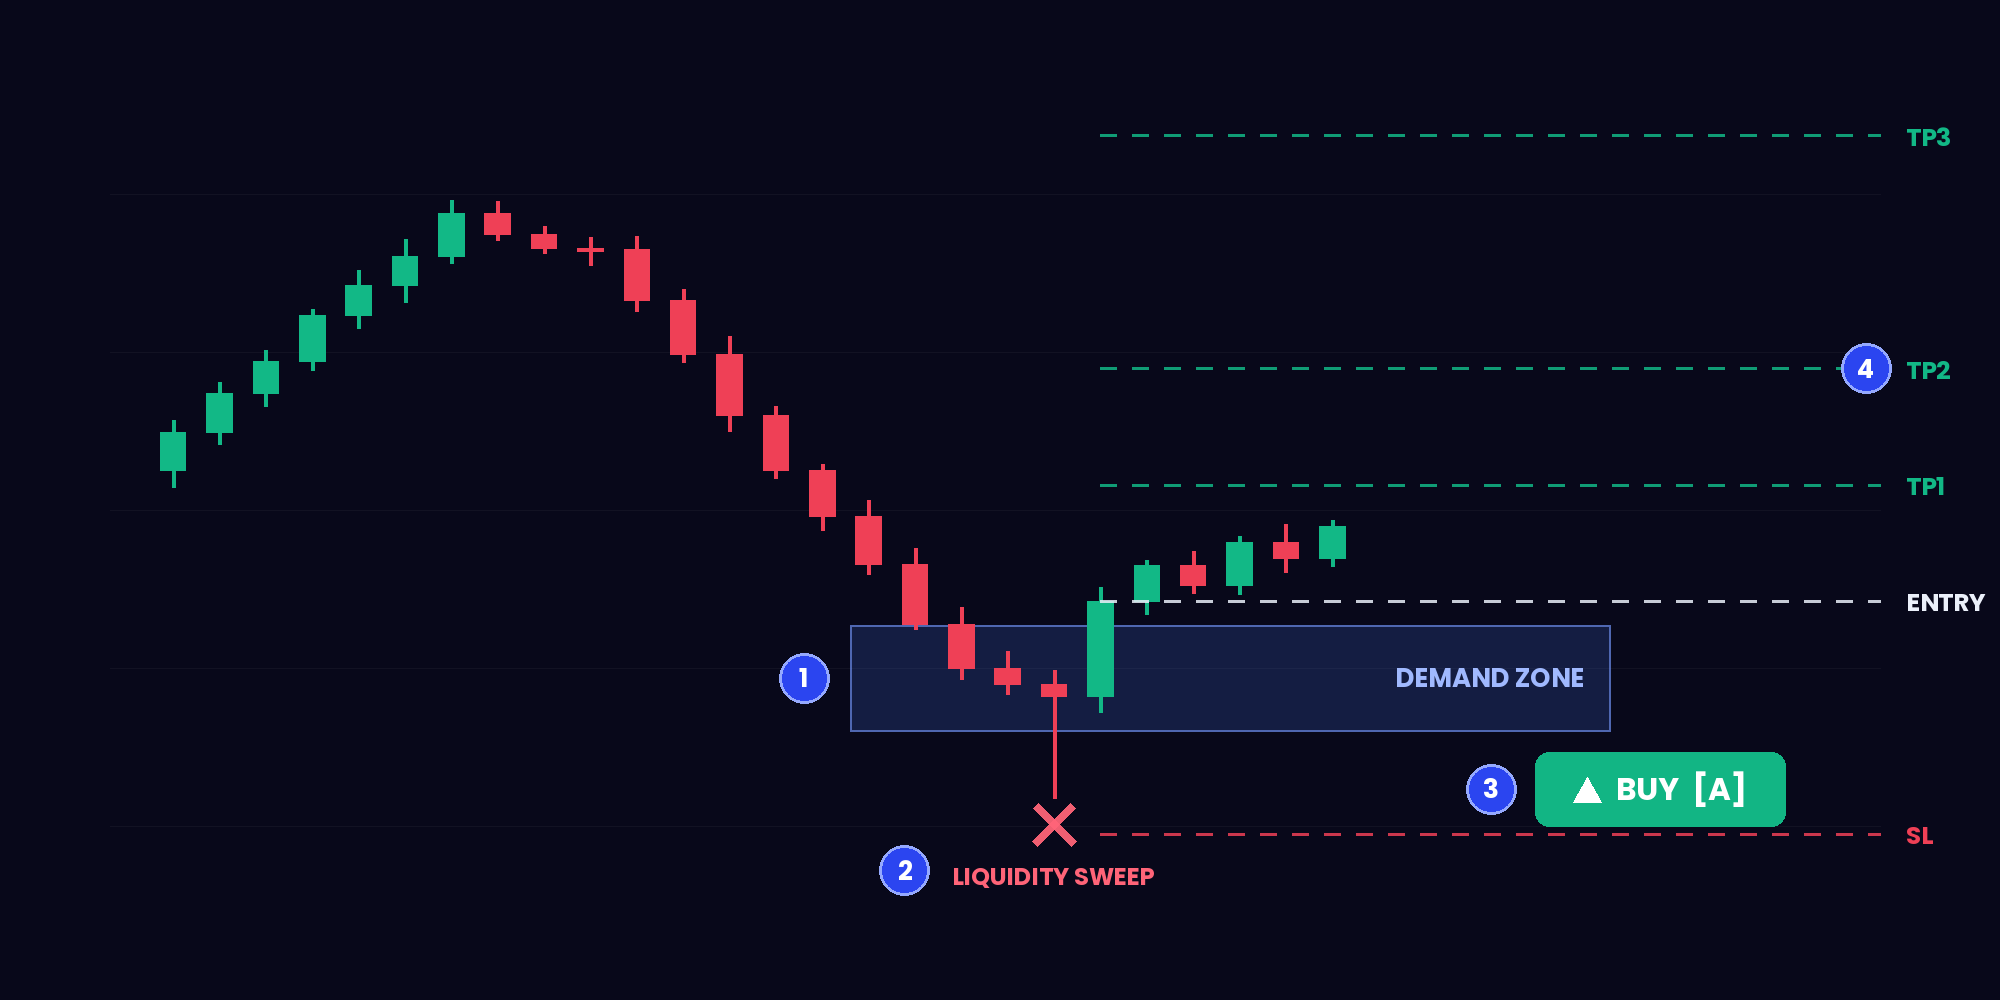
What SLF shows you
Market structure
See where price has broken structure and where it may find support or resistance.
Liquidity zones
Spot areas where orders may be concentrated and see when price sweeps through them.
Graded setups
Review the setup grade, direction, targets, and stop level in one place.
See SLF in action
Watch the walkthrough, see how TradingView access works, and compare monthly, quarterly, and annual plans.
Watch the SLF walkthrough